Analytics filtersmenu
Limits every section on the page.
Series, Sets, Rarity, Foil Type, Condition, Date Added, and Pricing Availability are menus. Favorites is a chip. Date Added options are All, 7D, 30D, 90D, and 1Y.
 Scott's TCG Binder
Analytics summarizes composition and change in the collection across six sections.
Analytics summarizes composition and change in the collection across six sections.
Mac
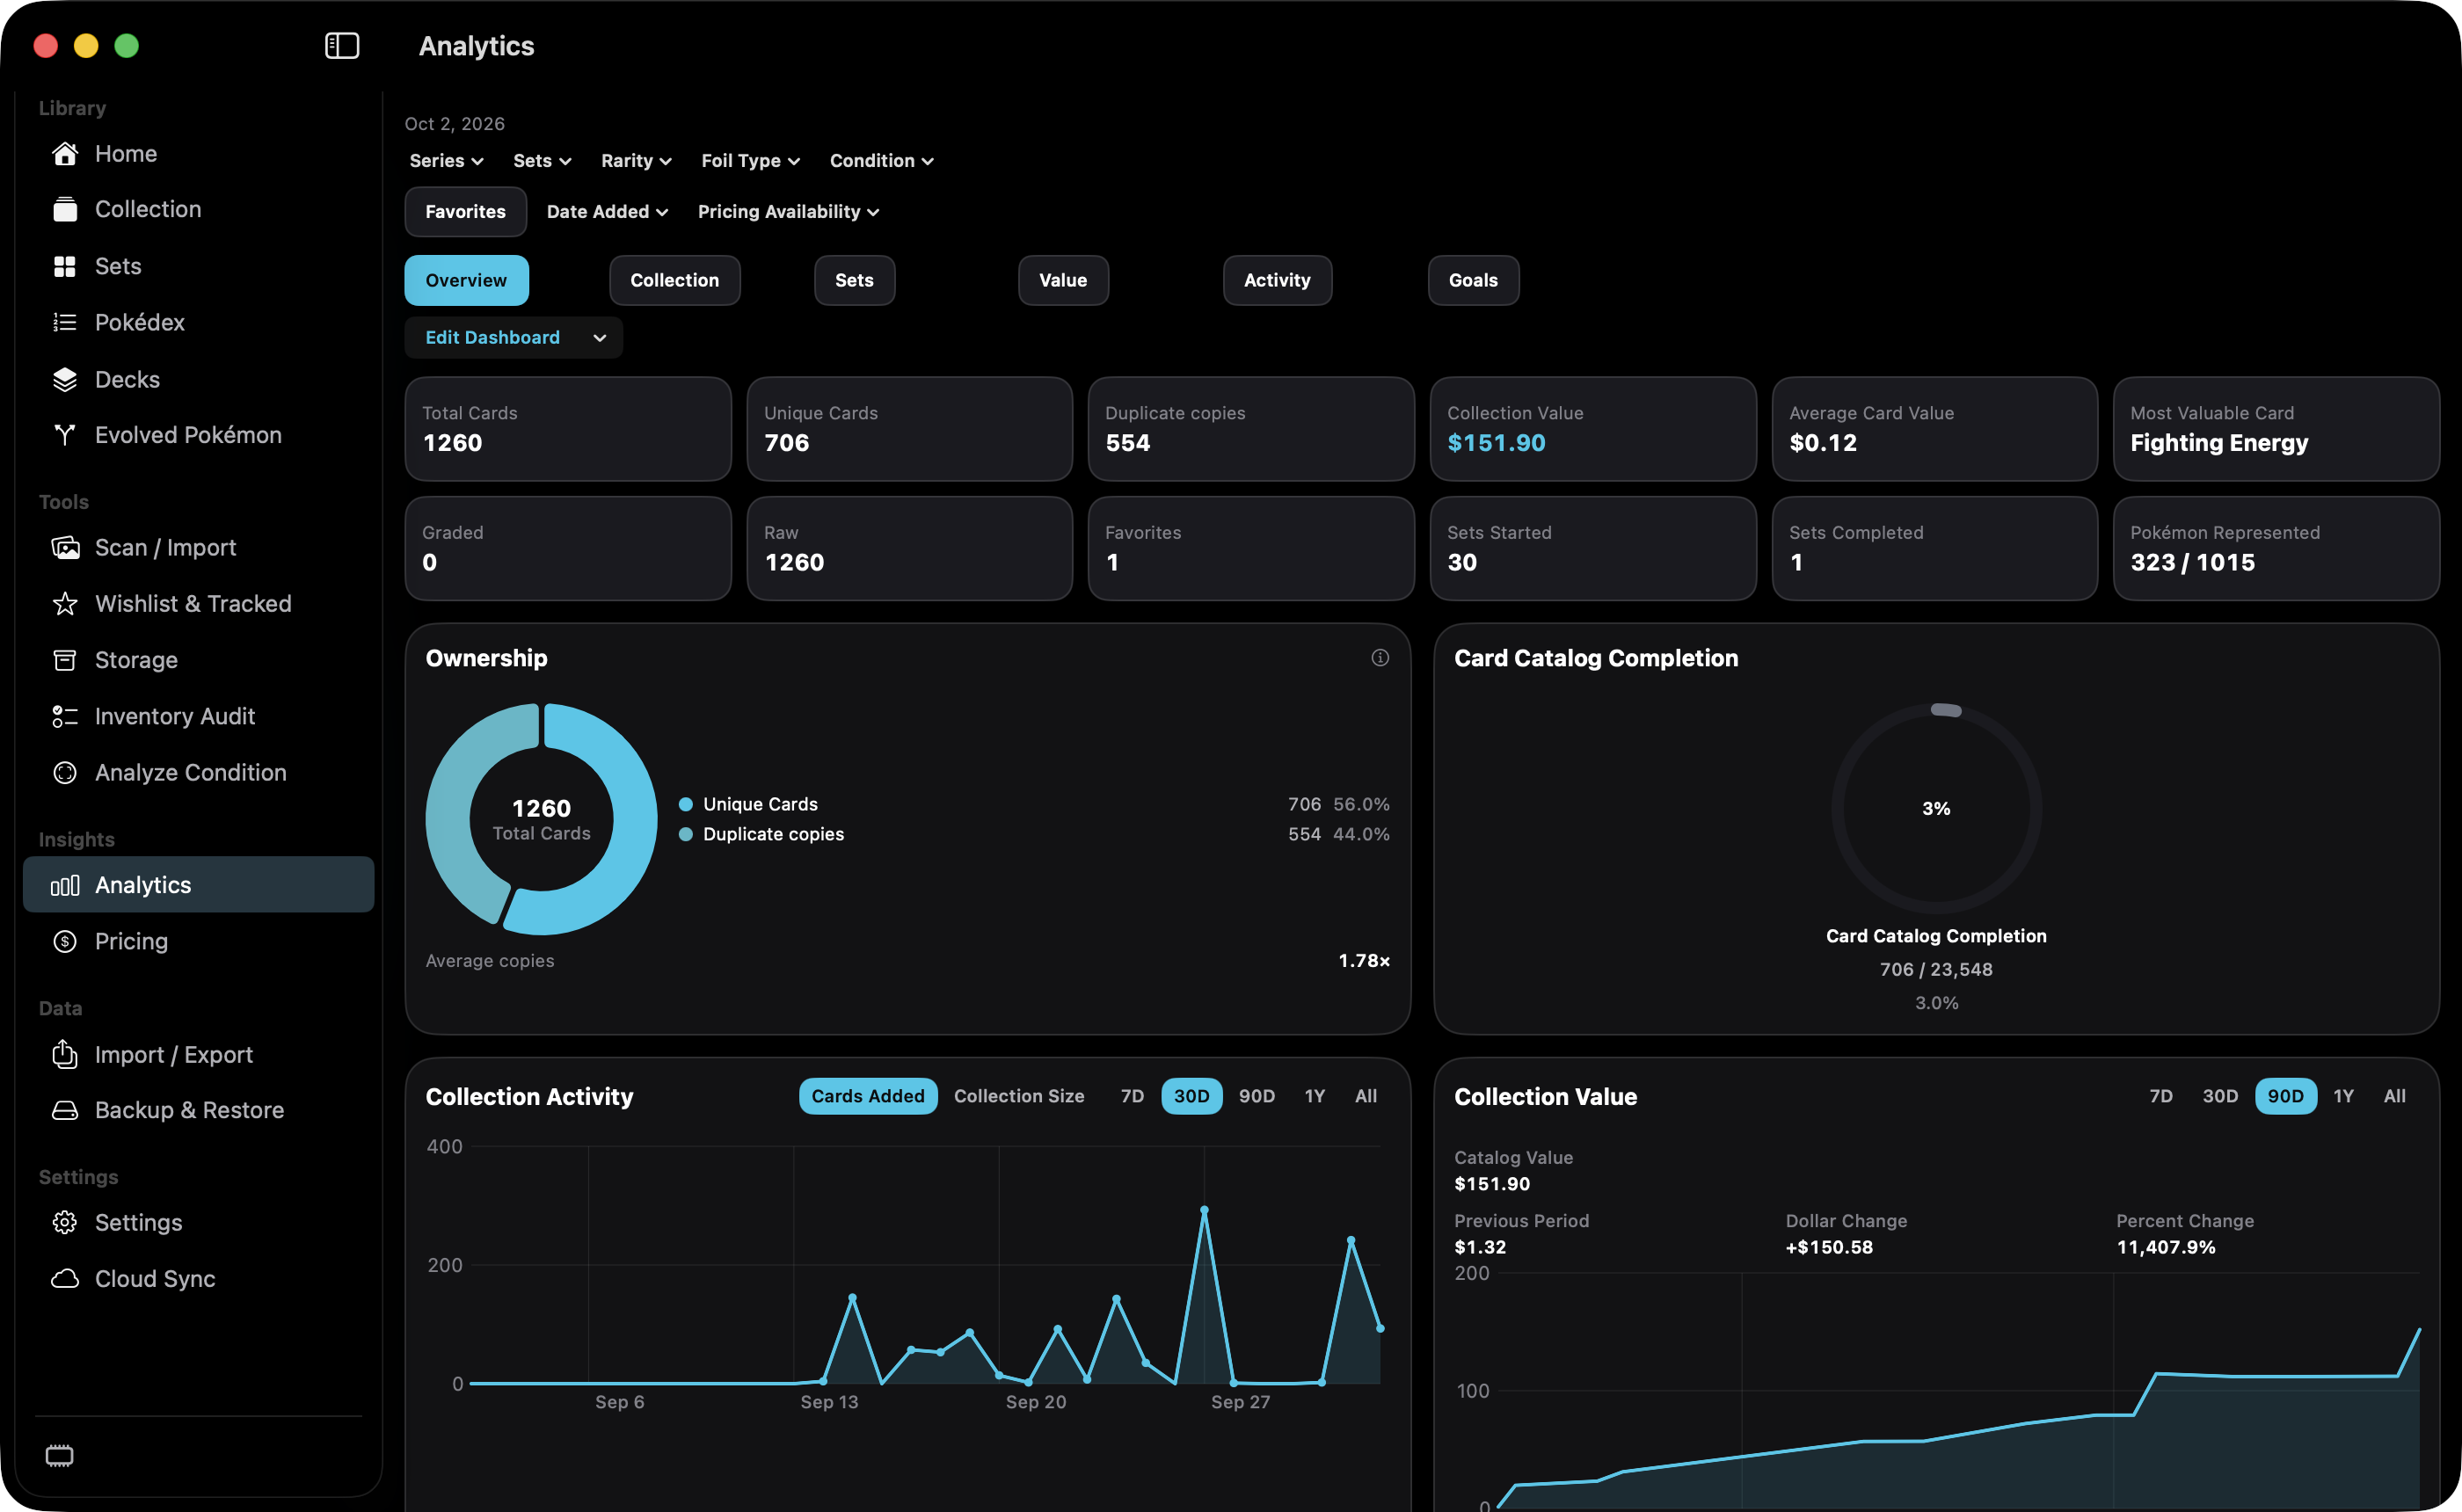
shot desktop-analytics · seq 17 · assets/screenshots/original/desktop/0017.png
iPhone
shot iphone-analytics · seq 111 · assets/screenshots/original/iphone/analytics.png
iPhone
shot iphone-analytics-collection · seq 112 · assets/screenshots/original/iphone/analytics-collection.png
Mac
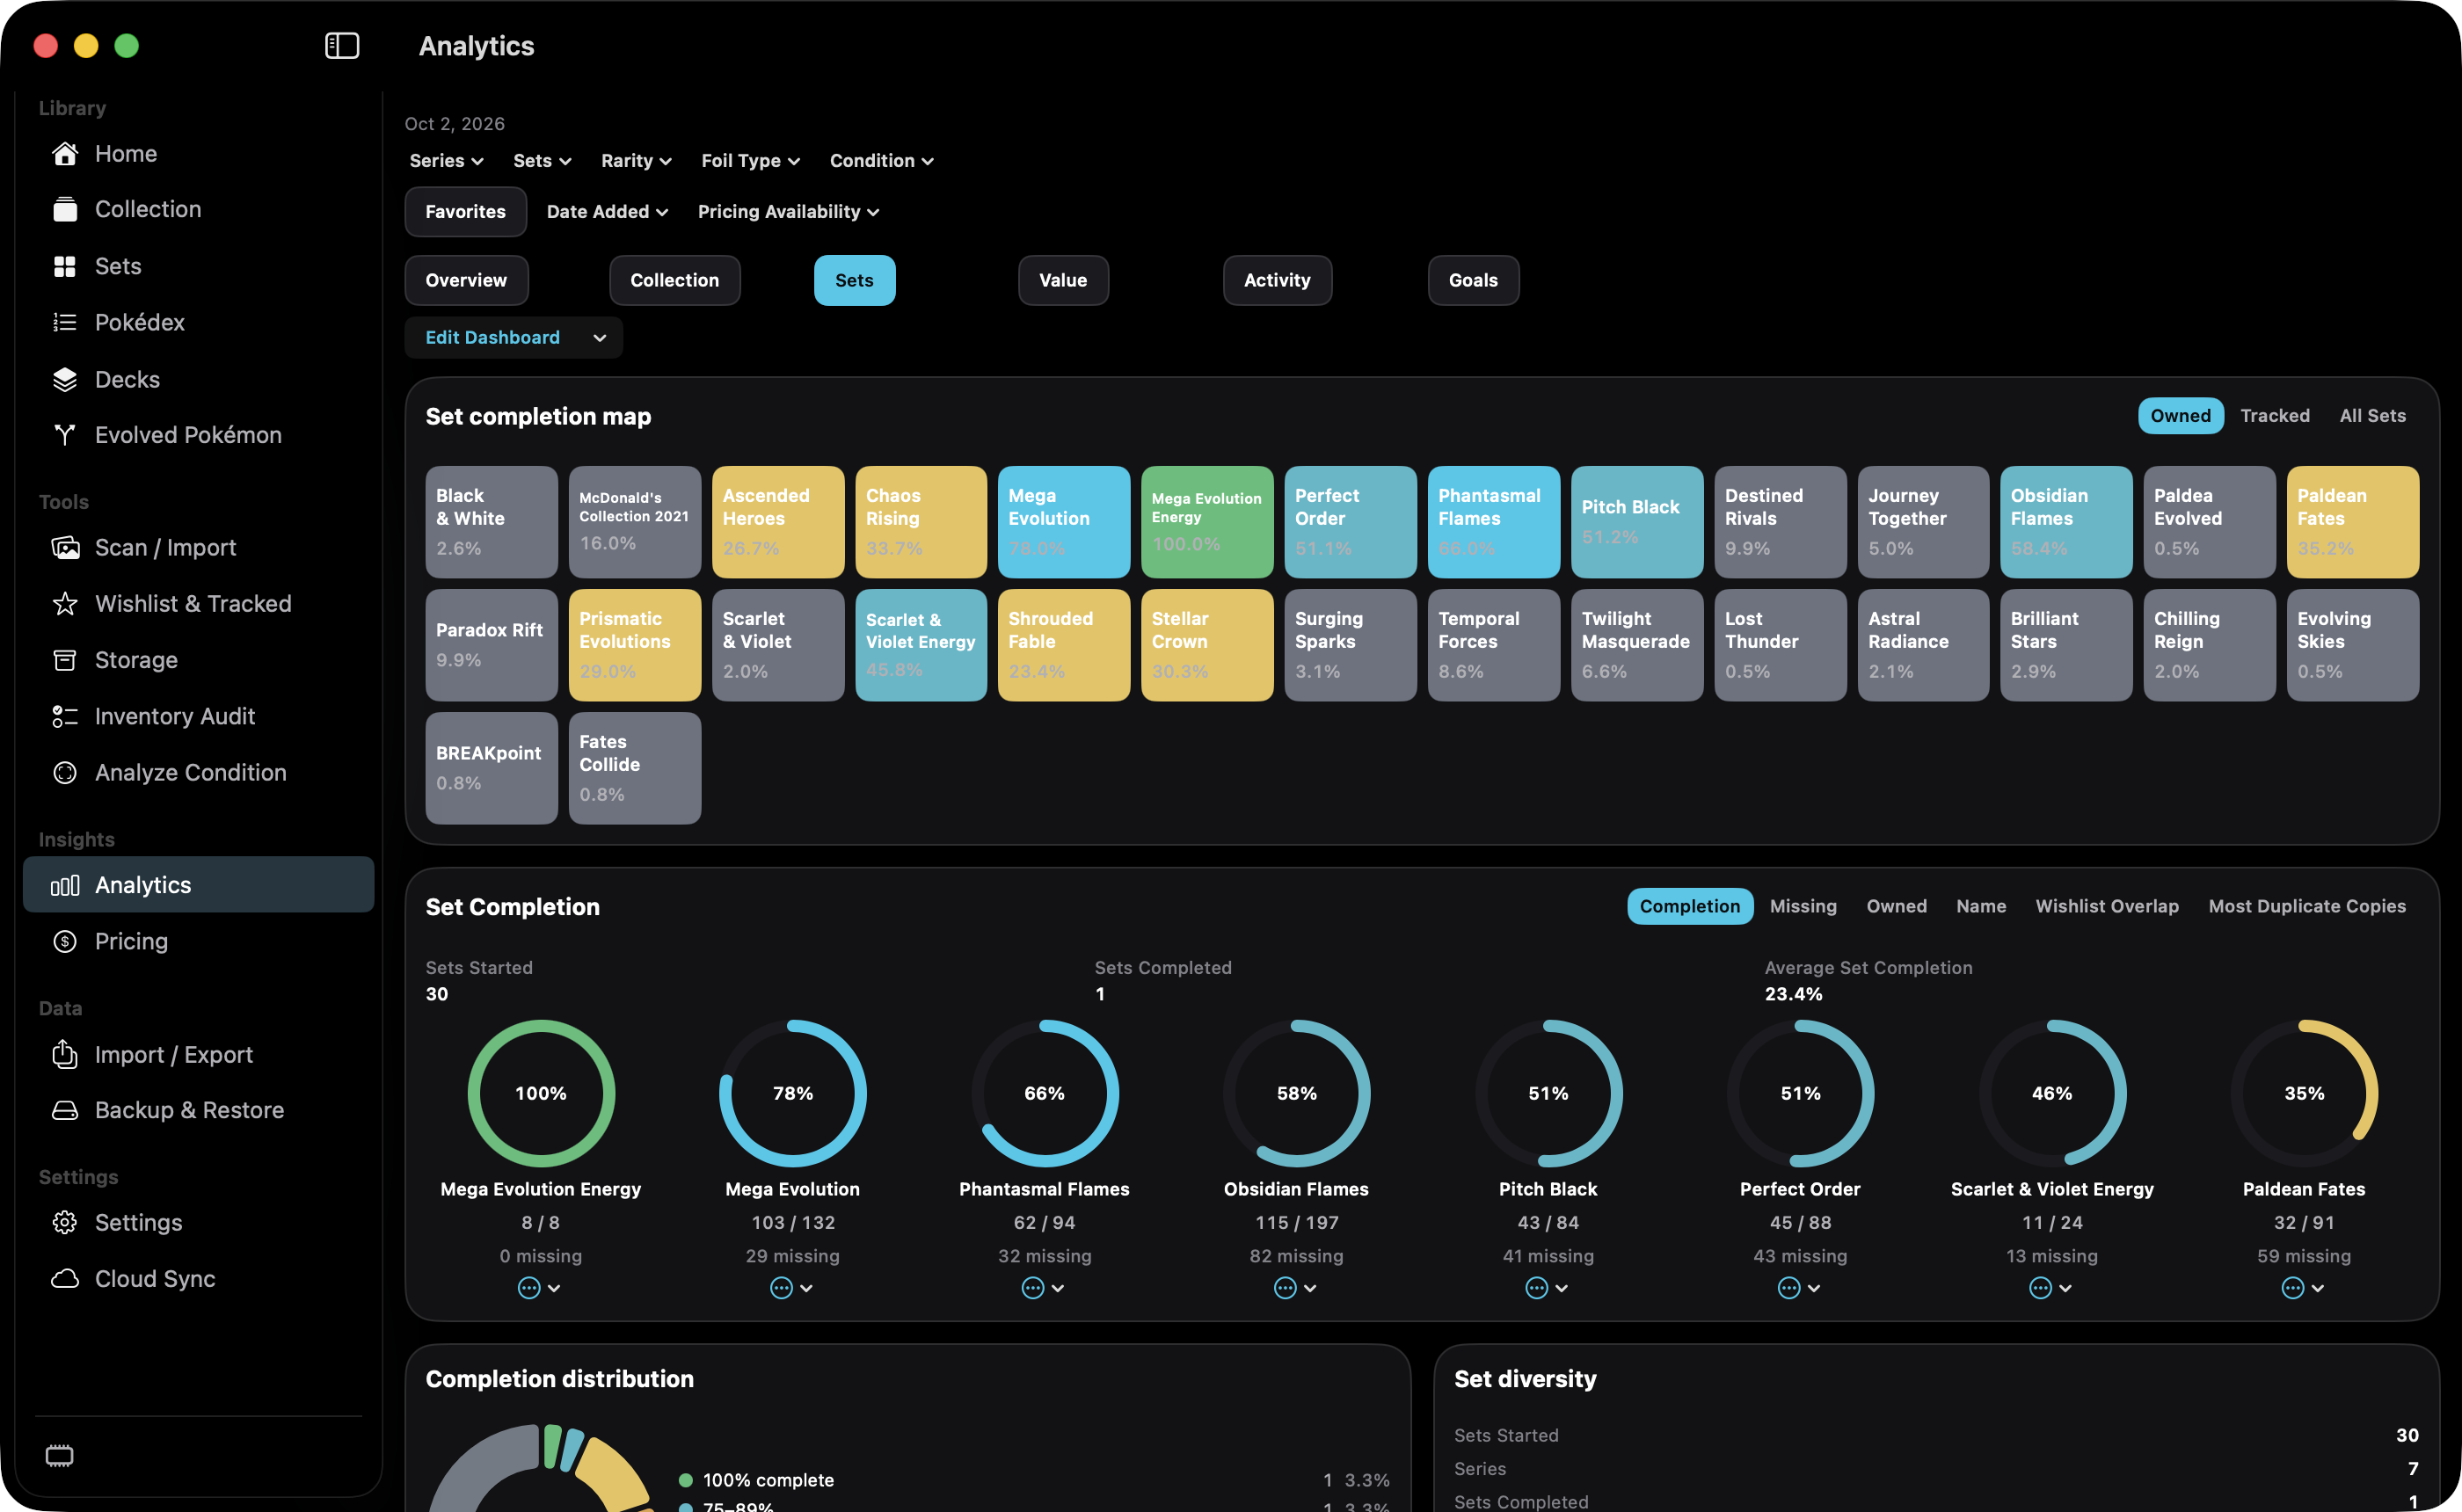
shot desktop-analytics-sets · seq 18 · assets/screenshots/original/desktop/0018.png
iPhone
shot iphone-analytics-sets · seq 116 · assets/screenshots/original/iphone/analytics-sets.png
iPhone
shot iphone-analytics-completion · seq 117 · assets/screenshots/original/iphone/analytics-completion.png
Mac
shot desktop-analytics-value · seq 34 · assets/screenshots/original/desktop/0034.png
iPhone
shot iphone-analytics-value · seq 114 · assets/screenshots/original/iphone/analytics-value.png
Mac
shot desktop-analytics-gainers · seq 35 · assets/screenshots/original/desktop/0035.png
iPhone
shot iphone-analytics-gainers · seq 115 · assets/screenshots/original/iphone/analytics-gainers.png
Mac
shot desktop-analytics-activity · seq 33 · assets/screenshots/original/desktop/0033.png
iPhone
shot iphone-analytics-activity · seq 113 · assets/screenshots/original/iphone/analytics-activity.png
Mac
shot desktop-analytics-goals · seq 36 · assets/screenshots/original/desktop/0036.png
iPhone
shot iphone-analytics-fewest · seq 118 · assets/screenshots/original/iphone/analytics-fewest.png
iPhone
shot iphone-analytics-goals · seq 119 · assets/screenshots/original/iphone/analytics-goals.png
iPhone
shot iphone-analytics-opportunities · seq 120 · assets/screenshots/original/iphone/analytics-opportunities.png
Additional platform screenshots will be added as this guide is expanded.
Limits every section on the page.
Series, Sets, Rarity, Foil Type, Condition, Date Added, and Pricing Availability are menus. Favorites is a chip. Date Added options are All, 7D, 30D, 90D, and 1Y.
Changes the time window for activity, value, and price movement.
Collection Activity and Collection Value use 7D, 30D, 90D, 1Y, and All. The capture shows activity on 30D and value on 90D. Top Gainers and Top Decliners use 7D, 30D, and 90D. On a Mac these are segmented buttons when they fit and a menu when they do not. On iPhone and iPad they are always menus.
Chooses the analytics section and, inside a section, how a list is sorted.
Section chips are Overview, Collection, Sets, Value, Activity, and Goals. Set Completion sorts by Completion, Missing, Owned, Name, Wishlist Overlap, or Most Duplicate Copies. The set completion map switches Owned, Tracked, and All Sets. Collection by Rarity still has Metric Count and Metric Value chips.
Understand how the collection is changing.